htop
An interactive process viewer with color display, scrolling, filtering, and mouse support.
Website: https://htop.dev
Project: https://github.com/htop-dev/htop
Author: Hisham Muhammad
Alternative to: top (See 10 others)
Language: C
This page last updated:
htop improves on top with a full-screen color display, vertical and
horizontal scrolling through the process list, and the ability to kill
or renice a process without typing its PID. The header shows per-core
CPU meters, memory and swap bars, and system load averages at a glance.
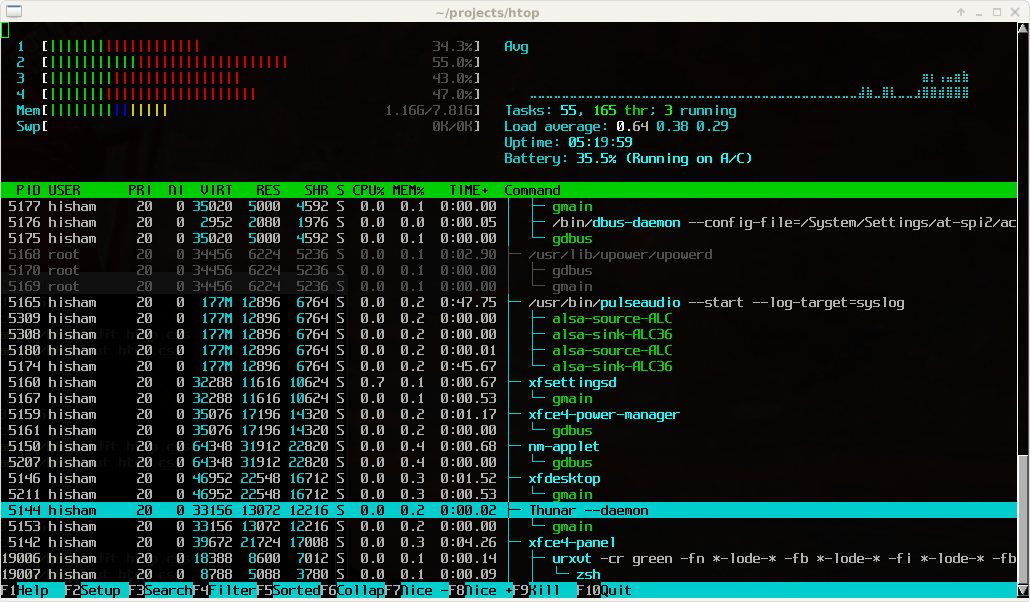
The interface is fully interactive: press / to search processes, \
to filter, t to toggle tree view, and F6 to change the sort column.
Mouse clicks work throughout. A built-in setup screen lets you customize
colors, choose which meters to show, and configure display options
without editing config files.
htop runs on Linux, FreeBSD, NetBSD, OpenBSD, macOS, and Solaris. Originally written by Hisham Muhammad, it is now maintained by the htop-dev team.
Basic usage
htop              # Launch the interactive process viewer.
htop -u username  # Show only processes for a specific user.
htop -p 1234,5678 # Monitor specific PIDs only.